
This Is Normal
August 26, 2024 •
We know that navigating the stock market’s ups and downs can be challenging, especially during periods of increased volatility.
To provide some perspective and reassurance, we wanted to share some insights from a recent blog article by one of our favorite writers in the financial community, Ben Carlson (read his blog HERE) that sheds light on the current stock market situation and the nature of market corrections.
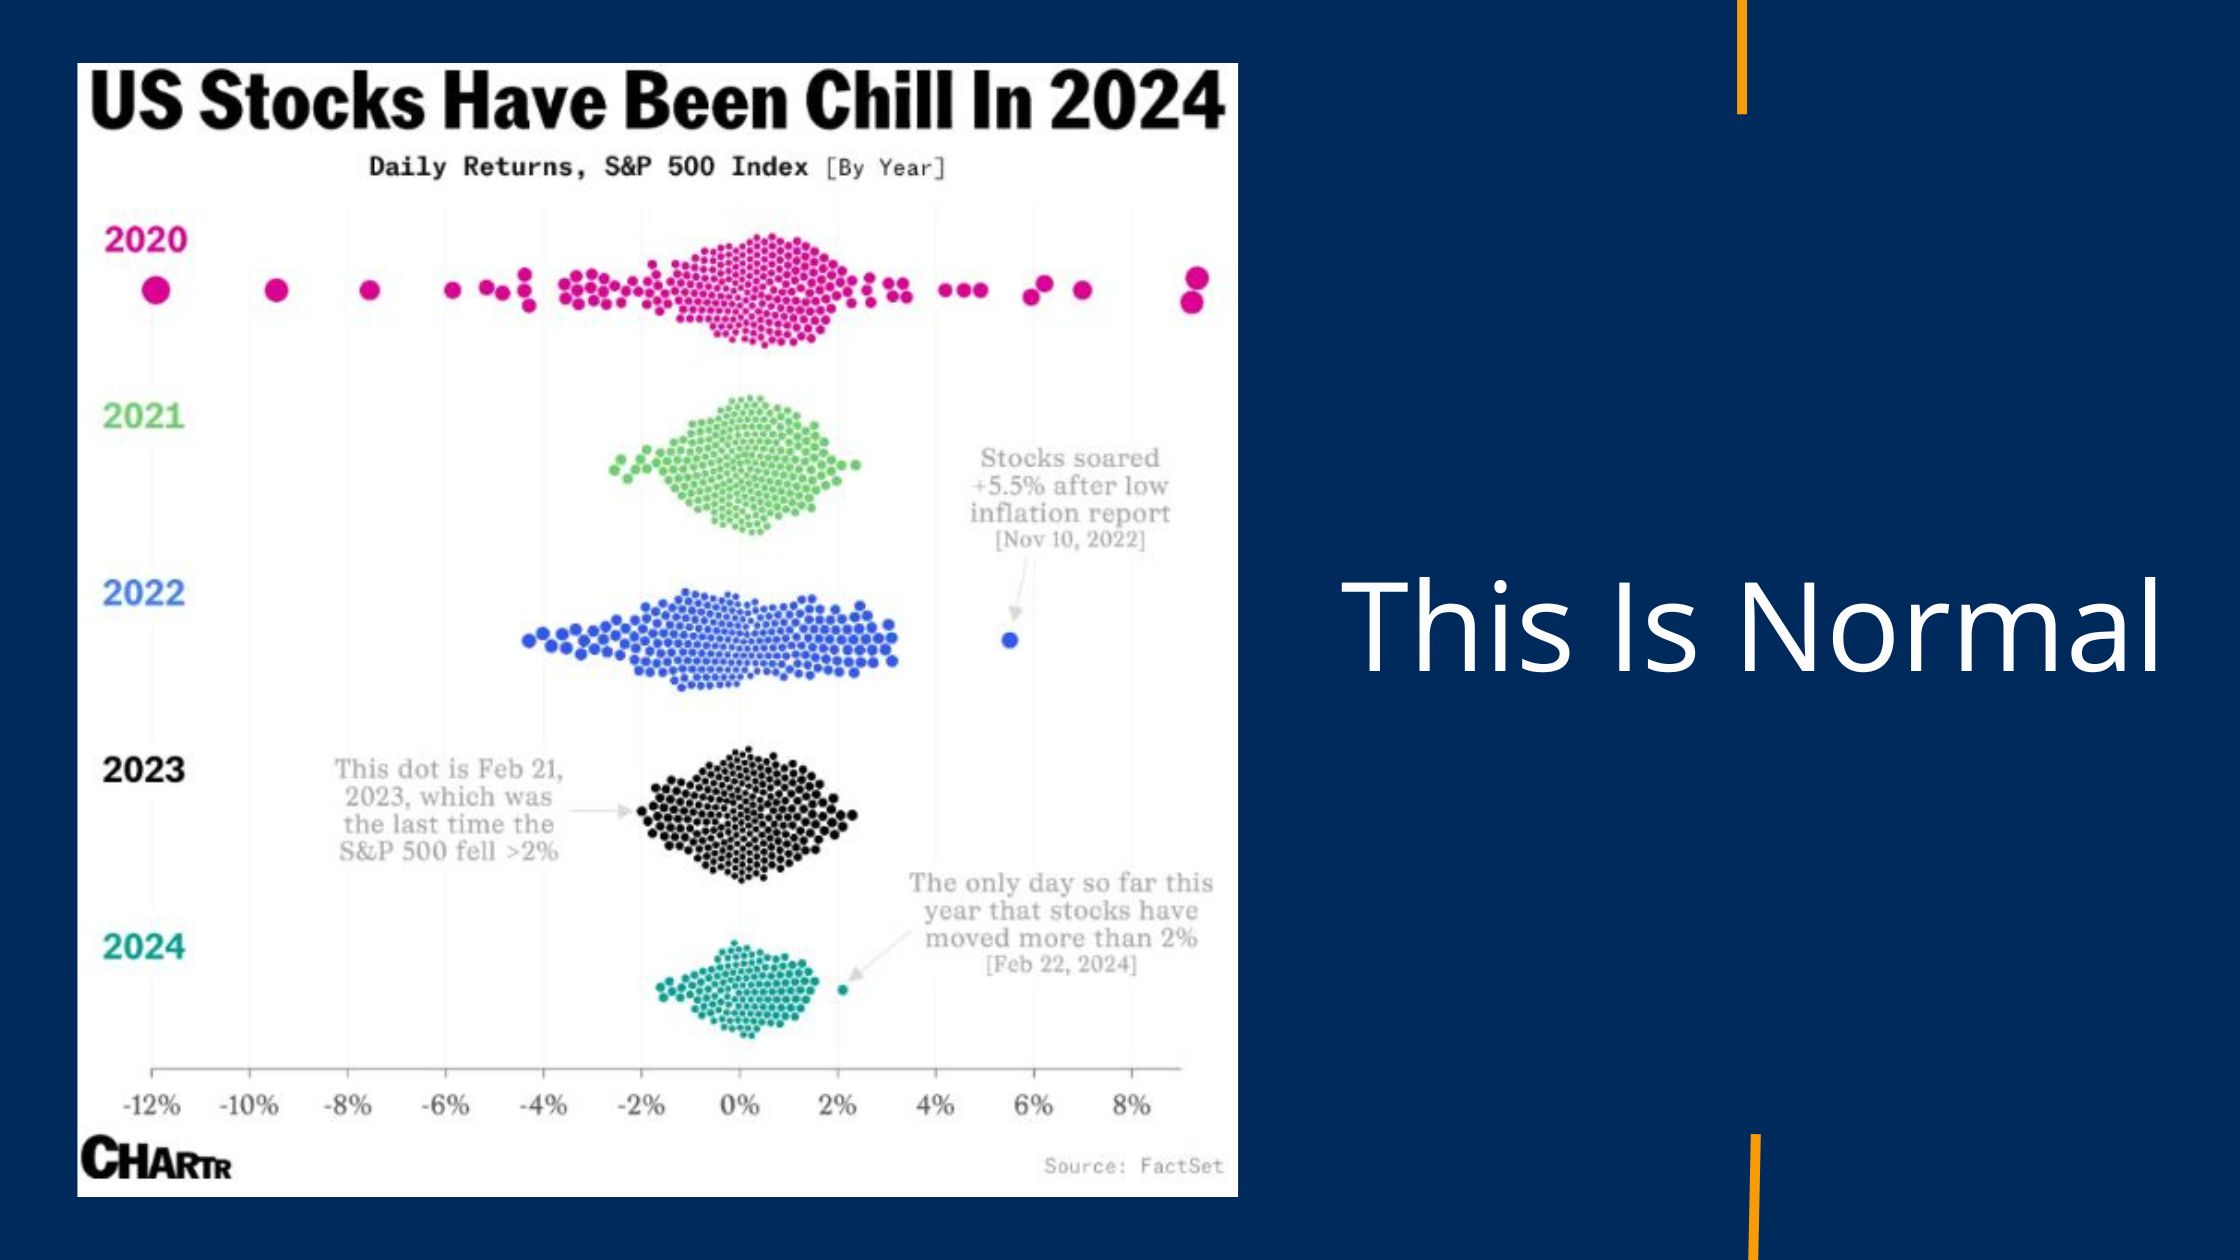
In his article, Ben highlights the striking chart above showing the unusual calmness of the stock market in 2024 up to last week. Until this point, 2024 had only one day where the market moved more than 2% in one day, which is abnormally calm, as you can see when you compare it to the previous four years. It’s important to remember that such calm periods are not sustainable indefinitely. As Ben points out, “The stock market is supposed to fall every once in a while.”
During times like these it is easy to get caught up in the short-term, fear narrative, especially if you watch a lot of cable news or are big on social media, but a long-term outlook is critical to long-term investing success. Here’s some important historical context to keep things in perspective:
- The U.S. stock market typically experiences a correction almost every year.
- A 5% downturn is almost guaranteed annually.
- A double-digit drop occurs in about two-thirds of the years since 1928.
- Historical data indicates that the average intra-year drop from 1928 to 2023 was -16.4%. Since 1950, the average correction in a given year was -13.7%, and in this century, it has been -16.2%.
Ben emphasizes that: “The stock market goes down even when it goes up.” If you go all the way back to 1928, most years in the S&P 500 (500 largest US companies) are positive years, but there’s still negatives during those years:
- From 1928 through 2023, the S&P 500 was up 70 out of 96 years (73% of the time). In half of those years with positive returns, there was a double-digit correction along the way.
- The S&P 500 has ended the year up double-digits in 56 out of 96 years since 1928 (almost 60% of the time). In nearly 45% of those years, there was a correction of 10% or worse on the path to those gains.
Volatility is a natural part of investing in stocks, which are so important to drive long-term returns in your financial plan. “Volatility is the price of admission when it comes to investing in equities. That’s true when markets go up or down.”
Please know that this is normal. Can it be a little scary? Yes, and it’s okay to feel that way, but it doesn’t mean anything is broken.
![]()
102 WEST HIGH STREET, SUITE 200
GLASSBORO, NJ 08028
HFM Investment Advisors, LLC is a registered investment adviser. All statements and opinions expressed are based upon information considered reliable although it should not be relied upon as such. Any statements or opinions are subject to change without notice. Information presented is for educational purposes only and does not intend to make an offer or solicitation for the sale or purchase of any specific securities, investments, or investment strategies. All investments involve risk and are not guaranteed. Information expressed does not take into account your specific situation or objectives and is not intended as a recommendation appropriate for any individual. Listeners are encouraged to seek advice from a qualified tax, legal, or investment advisor to determine whether any information presented may be suitable for their specific situation. Past performance is not indicative of future performance.